The growing power of remittances, in five charts

While the size of the global remittances market may ebb and flow with the global economy, one thing is clear – it’s massive, at over $700 billion in payments each year and growing.

As a reference, according to the World Bank, if remittance volume was its own county, it would rank as the 20th largest global economy — that’s larger than the economies of countries such as Norway, Colombia, Sweden, Argentina, South Africa, Argentina, and Ireland, just to name a few.

Since cross-border remittances affect so many global citizens, both the World Bank and United Nations have initiatives aimed at lowering their cost and improving access. The UN has declared June 16th as the International Day of Family Remittances to reflect their importance.

“Family remittances have a direct impact on the lives of 1 billion people — one out of seven individuals on earth. Added together, remittances are three times greater than Official Development Assistance and surpass Foreign Direct Investment,” said António Guterres, Secretary-General of the UN, in a press release to commemorate the day.
PSO.01242020.REM1.png
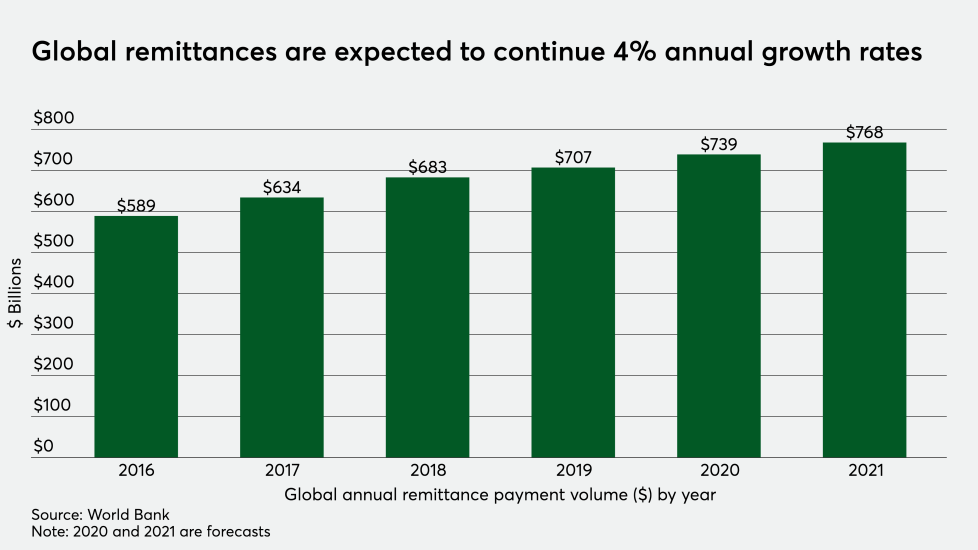
The global remittance payment volume is estimated to have grown by 3.5% in 2019, to $707 billion, up from $683 billion in 2018. According to data from the World Bank, the volume of remittances is expected to pick up speed to grow at just over 4% annually over the next two years, reaching $768 billion in 2021.

While remittance payment volume had been growing at over 7% annually for the last few years, several factors temporarily impacted its growth, with notable influences including the decline in oil prices. This impacted countries such as Russia sending money to Central Asian countries. Another factor was the overall softening of several major global economies such as Germany and China.

The largest growth in remittance inflows is to markets the World Bank identifies as low and middle income countries or LMICs which include nations such as Angola, Bangladesh, Bolivia, Cambodia, El Salvador, Egypt, Honduras, India, Indonesia, Kenya, Nigeria, Pakistan, the Philippines, Sudan, Ukraine, Vietnam and Zimbabwe. The LMICs have grown in their share of total global remittances over the past decade. In 2019, the LMICs garnered approximately 78% of all global remittances, up from roughly 72% in 2010.
PSO.01242020.REM2.png
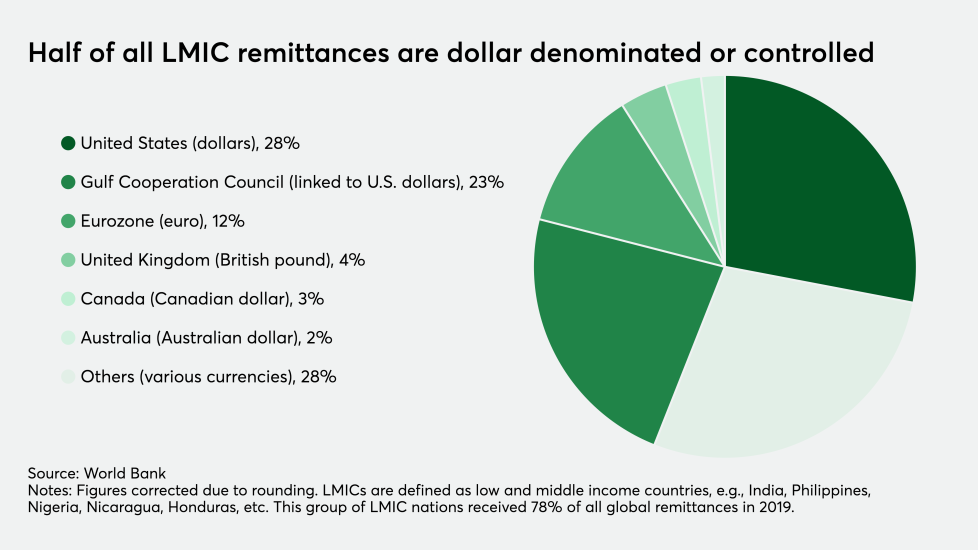
The U.S. dollar has a major impact on global remittances by accounting for half of all payments sent to LMIC nations. Based on data from the World Bank, 51% of all remittances sent to LMIC nations are made in U.S. dollars or currencies from the GCC countries that are tied to the U.S. dollar.

According to PwC, since the mid-1980s, five of the six Gulf Cooperation Council (GCC) countries have had their currencies pegged to the U.S. dollar, with the exception being Kuwait, whose currency is pegged to a basket of global currencies which includes the dollar. The reasons behind using the dollar as a peg is a combination of political and economic needs for stability since global oil, the GCC’s main export, is largely traded in U.S. dollars.

As a result, the recipients of dollar-denominated remittances in places like the Philippines, Nicaragua or India are sometimes the beneficiaries of a strong dollar or victims of a weak one. This is because the purchasing power of a recipient in Manila will ultimately be determined by how the U.S. currency is faring against the Philippine peso at time of receipt.
PSO.01242020.REM3.png
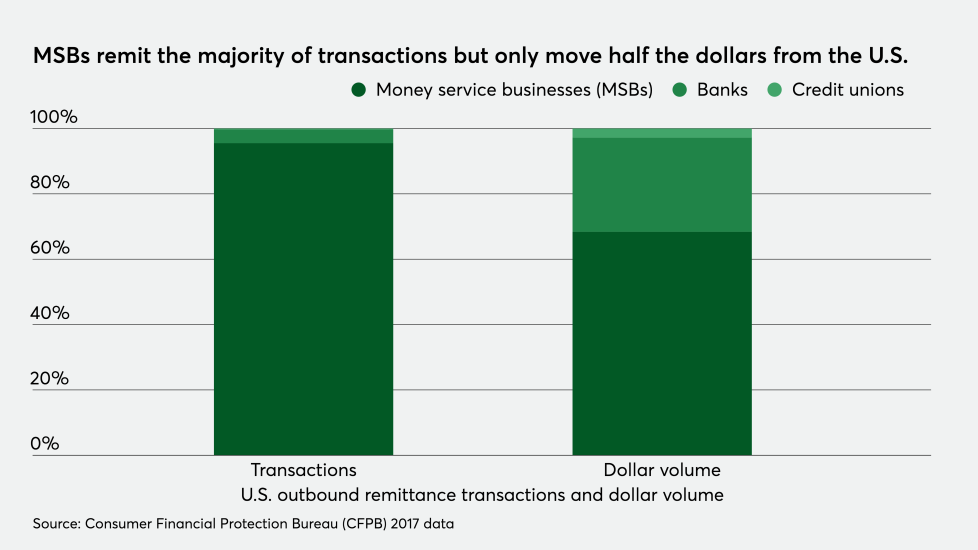
Following the implementation of new remittance rules in 2014 to better protect U.S. consumers sending money overseas, the Consumer Financial Protection Bureau undertook a study of the market and found that money service businesses (MSBs) such as MoneyGram and Western Union dominate the market. According to the CFPB’s Remittance Rule Assessment Report, 95.6% of all remittance transactions conducted by U.S. consumers are handled by MSBs, with banks taking a 4.2% share and credit unions a roughly 0.2% share. The total number of U.S. originated transactions in 2017 was estimated to be 375 million.

However, when the CFPB took a closer look at the dollar payment volume, it found that banks tended to be used for larger transactions compared to MSBs or credit unions. MSBs handled only 68.4% of the remittance payment volume compared to banks, which handled 28.8%, and credit unions, which held a 2.8% share.

MSBs had an average transaction size of $381 compared to banks, which had an average transaction size that exceeded $6,500.
PSO.01242020.REM4.png
The cost of transferring funds has many dependent variables including currencies, countries of origination and receipt destination, cash out options, etc. — however, the World Bank found that one of the most impactful factors on pricing was the type of transmitter used.

The two lowest-cost channels were a country’s national Post Office and money transmitters (when there was deemed sufficient local competition). The most expensive channels were banks, taking an average fee equivalent to 10.3% of the transaction, according to the World Bank.

One interesting anomaly uncovered in the World Bank’s research was that when countries attempted to lower remittance pricing by offering an exclusive deal to an MTO, it actually raised prices. For example, when the national Post Office partnered with a single MTO the average price charged by this collaboration averaged about 8.3%, representing a 2.3 percentage-point premium over standard MTO rates. In other words, an exclusive partnership on average caused remittance rates to rise by 38%.

The World Bank noted that the highest incidence of premium pricing it uncovered in its research resulting from the Post Office collaborating with the dominant MTO was in India. In this case, the premium extracted from this partnership represented 4.6 percentage points. This premium in effect delivered pricing on par with the fees charged by banks.
PSO.01242020.REM5.png
While India, China and Mexico continue to be at or near the top of the annual list of remittance-receiving countries in total dollar volume, the actual economic impact of the money sent to those countries may not be as large as commonly believed.

Based on 2019 data from the World Bank, India retained its crown from 2018 as the top remittance receiver taking in $82.2 billion, followed by China at $70.3 billion and Mexico at $38.7 billion, taking the third spot from the Philippines, which had $35.1 billion for 2019.

The best way to judge the impact of money sent back home from friends and relatives abroad is to measure remittances received against a country’s GDP. In the case of India, remittance only measured up to 2.8% of the country’s GDP. In the case of China it was only 0.5%, and Mexico was just 3.1%. While this money is important to those receiving the funds, at a national level the values are relatively inconsequential. In comparison, remittances sent to the Philippines were almost 10% of the country’s GDP — a sizable economic catalyst. Remittances for the next six top receiving countries also had a measurable impact on their respective economies.

As a reference, in the World Bank data the smallest economies tended to have the biggest boost when it came to remittances. For example, remittances to Haiti represented 34.3% of that country’s economy, while Honduras and El Salvador each earned over 20% of their GDPs from remittances sent from overseas.
MORE FROM AMERICAN BANKER