6 lessons from Asian e-commerce

Much is made of the U.S. e-commerce market given the influence of Amazon and its peers. However, when it comes to sheer size in both population and volume, Asia holds significant advantages.

E-commerce volume for the U.S. was approximately $742 billion in 2017, and for the five largest European countries the category rang up a collective $473 billion according to the PPRO Payments Almanac. In comparison, the Asia Pacific region experienced a collective sales volume of $1.36 trillion – almost double the U.S. market.

Three Asian countries — China, India, and Indonesia — hold almost half of the world’s population, according to the World Population Review. Despite the U.S. having a $21 trillion GDP, the No. 2 and No. 3 countries ranked by GDP according to the IMF, China and Japan, have an almost equal combined economy at $14.2 trillion and $5.2 trillion, respectively.
ASI1
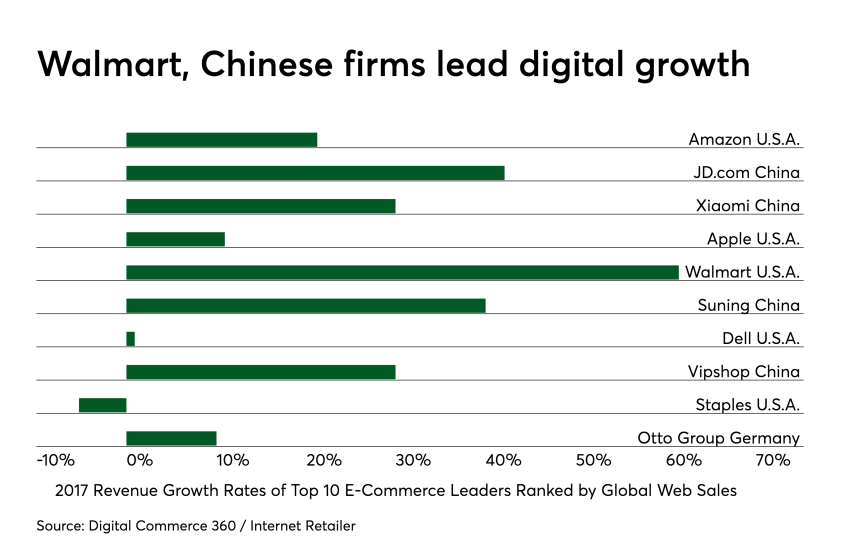
Among the 10 largest e-commerce firms based on global web sales, some are quite well known across the globe, such as Apple and Dell. Most of the others, especially the Chinese firms, are not necessarily household names outside of China. Among the top 10 e-commerce leaders, five are based in the U.S., four in China and one in Germany, according to Digital Commerce 360 and Internet Retailer.

While Walmart may stand out among the group for its strong growth, part of that boost in e-commerce in 2017 was related to its acquisition of Jet.com, an internet merchant selling everyday items. Amazon’s growth has been attributed to largely growing the U.S. e-commerce marketplace, according to an e-Marketer study showing the company as owning almost 50% of the U.S. e-commerce market.

Chinese rival mass merchant JD.com Inc., which sells both its own merchandise and facilitates sales for outside merchants (similar to Amazon's model), came in at No. 2 with 42% growth in 2017. Most recently, JD.com has begun the use of drones to make faster and more efficient home and office delivery of e-commerce purchases.
ASI2
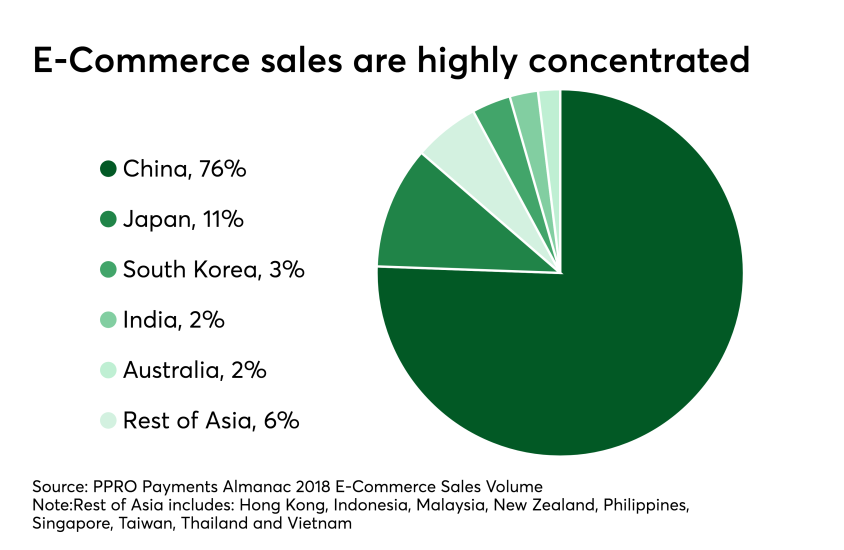
Despite Asia holding almost half of the world’s population, it contains a number of countries in varying states of development and e-commerce maturity. This has led to a disproportionate distribution of e-commerce sales volume focused on a handful of countries.

On the surface, it could be expected that the three most populous countries in Asia would generate the majority of e-commerce volume, and that smaller countries such as Australia (just a few more million people than the state of Florida) would be minor players. However, the data contradicts this.

China controls three-quarters (76%) of e-commerce sales volume in Asia, while India has a mere 2% share, with its 1.36 billion people; this is the same e-commerce share as Australia with its 25 million people. Overall, five Asian countries control 94% of total e-commerce sales in the Asia region, according to data from the PPRO Payments Almanac. Japan, with only 9% of the population of China, has an 11% share of Asia’s e-commerce market.
ASI3
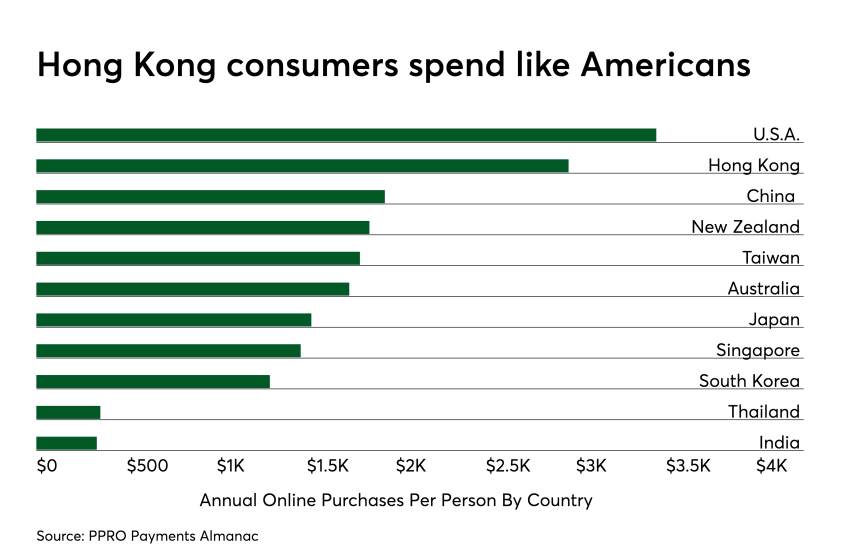
When it comes to spending money, few global consumers can measure up to U.S. buying habits, due to it being a consumer driven economy. Ringing in at an annual e-commerce spend of $2,959 per person, Hong Kong consumers come the closest in Asia to the U.S. level of $3,445 per person. Only a handful of countries spend more per person online than the U.S. — most notably the U.K., with $4,183 spend per person, based on data from the PPRO Payments Almanac.

Chinese consumers spend the second-most per person online at $1,935, putting them just ahead of French consumers, who spend $1,890 per person per year. Most of the major, developed Asian economies demonstrate very healthy per capita annual spend rates, ranging from $1,854 in New Zealand to $1,526 in Japan to $1,296 in South Korea.

While India may be a large country in both population and geographic size, its consumers spend only $339 annually per person, a somewhat low figure given the huge technology and infrastructure investments made by companies and the government. Vietnam came in last with $95 in annual spend per person.
ASI4
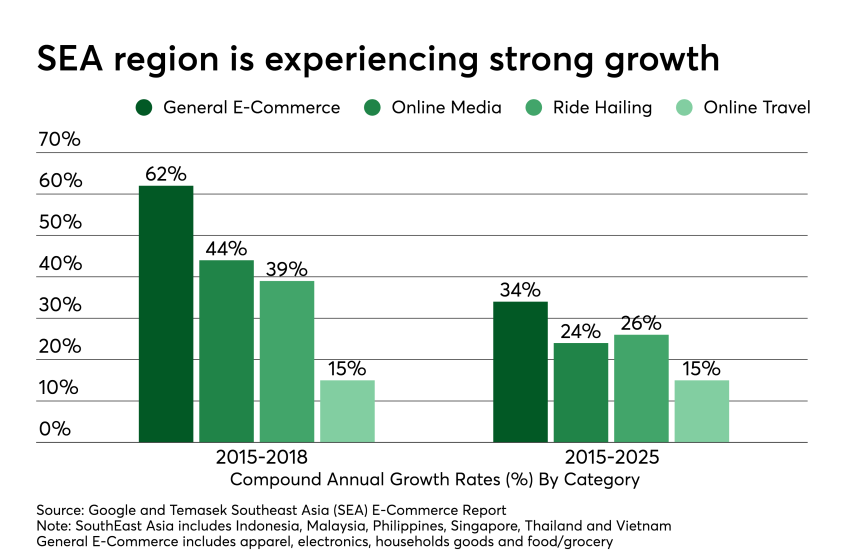
E-commerce growth in Southeast Asia is being driven across multiple categories as consumers are seeing the value in not only buying apparel online, but also using it for ride hailing services, online travel and media, which includes gaming. According to a study by Google and Temasek Holdings, Singapore’s sovereign fund, the double digit growth rates for several e-commerce categories are expected to continue through 2025.

Ride hailing, almost unheard of just 10 years ago, experienced a 39% compounded annual growth rate (CAGR) during the 2015 – 2018 period. While the growth is expected to slow for ride hailing services in the future, it will still log in at a 26% CAGR over the 10 year period of 2015-2018 in Southeast Asia.

The most important statistic to look at for the growing Southeast Asia economies when it comes to e-commerce is the rapid growth rate of the general category which includes apparel, electronics, household goods and food/grocery. The CAGR during 2015-2018 was 62% in volume, the fastest of all categories measured. The general e-commerce category tends to be dominated by everyday items compared to media and travel which are more luxury goods. The growth of this basic category speaks to the overall basic demand in Southeast Asia for e-commerce.
ASI5
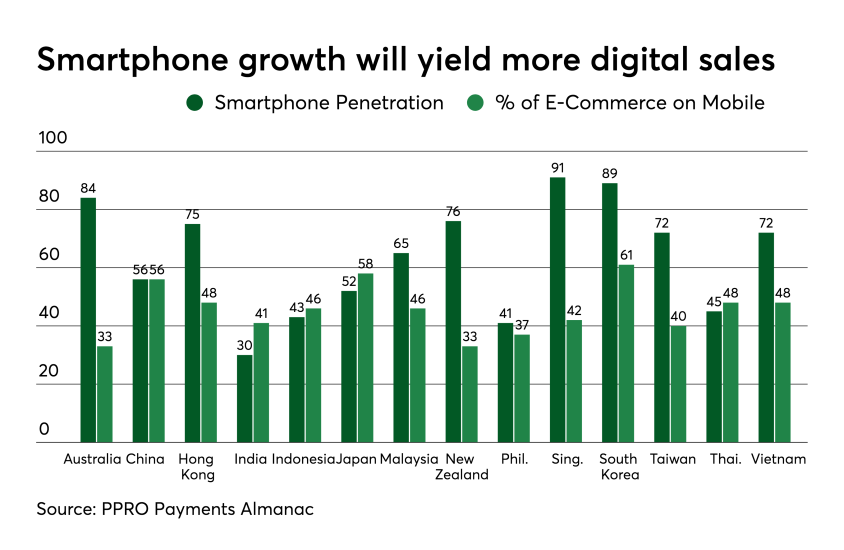
Smartphones are rapidly gaining penetration in many Asian countries and in a number of cases, bringing along mobile commerce. Unfortunately, it is not as simple as driving penetration of smartphones to grow mobile commerce. In some cases, it may be a combination of factors including mobile network access, disposition to making purchases on a smartphone and cultural events.

In China, Single’s Day is a major cultural event that celebrates a person’s singlehood and has quickly grown to become one of the largest shopping days, particularly for e-commerce. In 2018, Alibaba’s Single’s Day receipts totaled $30.8 billion, up 27% from 2017. This holiday has quickly spread to other Asian countries, especially ones with large native Chinese populations. As a reference, the U.S. holidays around Thanksgiving, Cyber Monday and Black Friday, only took in $6.59 billion and $5.03 billion in sales, respectively, according to Adobe.

Interestingly in markets where smartphone penetration is low, such as India, Indonesia and Japan, the proportion of e-commerce sales made by mobile device is relatively high, demonstrating that when users in these countries obtain mobile devices they are very inclined to use them for e-commerce, based on data from the PPRO Payments Almanac.
ASI6
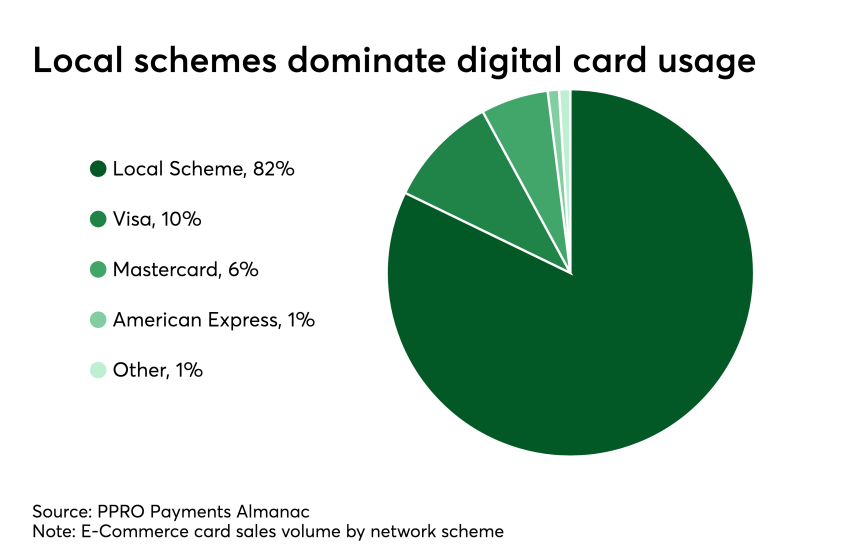
While the 1970s American Express card advertising slogan to encourage cardholder use was “don’t leave home without it,” when it comes to e-commerce shopping, Asian consumers prefer their local brands hands-down. According to the PPRO Payments Almanac consumers across Asia use cards to make 31% of e-commerce purchases based on sales volume, second only to e-wallets, such as Alipay, which comes in at 40% and ahead of bank transfers at 13% and cash on delivery at 10%

Even though Asian e-commerce buyers are reaching for their payment cards, Visa, Mastercard and American Express are not necessarily benefiting from this trend. Local card schemes tend to dominate in the major markets. China for example, has been a closed market for many years dominated by China UnionPay, which has a 97% market share of e-commerce purchases made by cards in China. In Japan, Asia’s second largest e-commerce market is home to JCB, which holds a 42% market share of all e-commerce purchases made by card.

One growing challenge to the international card networks are the domestic debit networks that have been created in recent years or have gained popularity due to their lower cost compared to Visa and Mastercard debit. For example, in Singapore where 74% of e-commerce transactions are made by card, 55% of it flows through the local scheme (NETS, which was founded in the 1980s by the local banks).
MORE FROM AMERICAN BANKER