Some regional banks became top performers by out-pacing their peers on loan growth, others by pursuing diverse sources of fee income. But core deposit growth might be the best indicator of which banks will have true staying power in the years ahead.
Low interest rates and a still tough regulatory environment kept net interest margins largely flat last year, but as rates inch up, banks of all sizes are going to be increasingly hungry for core deposits, said Kevin Halsey, a consultant with Capital Performance Group.
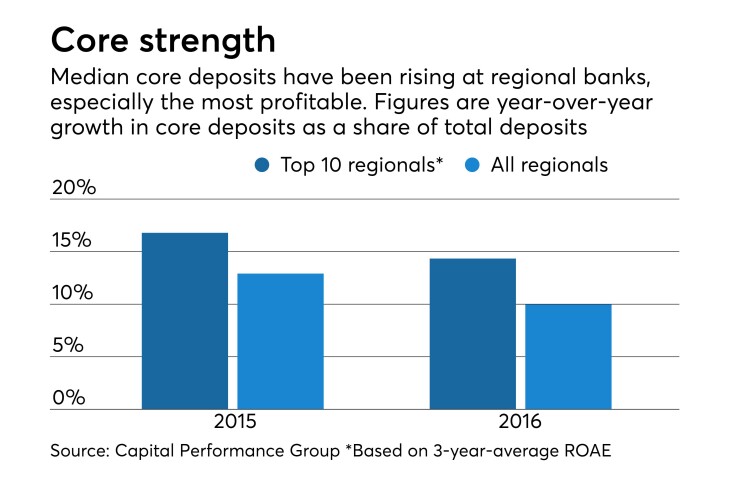
Regional banks with $10 billion to $50 billion of assets — ranked here by return on average equity across three years — generally grew core deposits at a respectable rate last year.
The 58 institutions that qualified for the ranking increased core deposits by a median of about 10% from the year before, according to CPG's analysis. But the banks at the top of the ranking attracted significantly more core deposits, with a median jump of about 13%.
"Some of the top banks have very, very robust growth in core deposits," Halsey said. "I think that will be a critical measure moving forward in 2017 and even into 2018."

Bank of the Ozarks practically doubled its core deposits, distinguishing itself with the largest increase by far of any bank on the list. Two acquisitions that it closed last summer added about $4.2 billion in deposits to its balance sheet, said Tyler Vance, the chief banking officer and chief operating officer at the $18.9 billion-asset bank in Little Rock, Ark. But organic growth, spurred by a "relationship banking" strategy, helped almost as much, bringing in an additional $3 billion in deposits, he said. Core checking accounts are a key metric for the bank, and last year it added more than 13,000 of those accounts through its legacy branches alone.
Core deposits at Western Alliance Bancorp. in Phoenix rose about 26% last year. Dale Gibbons, its chief financial officer, attributed the increase to organic growth, saying the $17.2 billion-asset bank has focused on bringing in commercial deposits from the small and middle-market businesses in its footprint. Western Alliance last closed on an acquisition in mid-2015, when it added $1.7 billion in deposits via Bridge Bank.
Another advantage the top performers had in common was a low efficiency ratio relative to the peer group. Though noninterest expense growth was particularly high for some — 37.5% at Bank of the Ozarks and 26.5% at Western Alliance, both well over the median of 6.8% for banks in this size range — they generated hearty loan growth and plenty of revenue to offset the higher expenses. Net loans increased by a median of 13.9% for the top 10 last year compared with peers' 8.7%.
Generally speaking the regional banks as a group generated more fee income than their highest-ranking counterparts. Noninterest income as a percentage of average assets was a median of 0.96% for the peer group and 0.82% for the top 10.
Even so, both Commerce Bancshares in Kansas City, Mo. (at 1.92%), and Bank of Hawaii in Honolulu (at 1.18%) stand out on that ratio, Halsey said.
-
The combination of higher regulatory expenses andreduced income from interchange fees is taking a toll on the profitability of banks with $10 billion to $50 billion of assets.
July 26
Mortgage banking provided much of the boost that the $16.5 billion-asset Bank of Hawaii had in its noninterest income last year, though asset management is an even heavier generator of fees overall. The bank reported a 72% increase in mortgage-related noninterest income, to $19.9 million, compared with the year before.
The $25.6 billion-asset Commerce has diversified its fee income across several business lines, with cards, wealth management and service charges on deposit accounts driving much of the growth, said Charles Kim, its CFO.
"We're not overly dependent on just one. It's not all cards, it's not all processing, it's not all wealth management," Kim said. "They tend to complement each other pretty well."