Pressure's on regionals to boost fee income

Net interest margins have been expanding at a nice clip over the past year, giving a boost to bank profits. But with the Federal Reserve likely to either hold the line on, or further cut, interest rates, margin expansion may grind to a halt.

Regional banks are especially vulnerable to this trend because they rely heavily on lending for profits and, unlike big banks, typically don't have large fee-generating operations to offset downturns in loan demand.

To be sure, regionals' median net interest margin climbed 16 basis points to 3.64% over the 12-month period that ended Dec. 31, 2018, as shown in our annual ranking of banks with $10 billion to $50 billion of assets.

But banks in this size range are very dependent on net interest income.
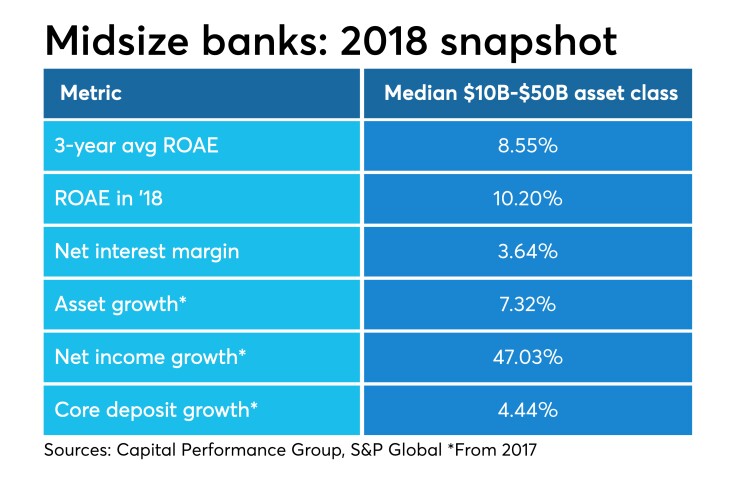
2018 snapshot of regional banks; includes ROAE and 3-year avg. ROAE

The median for net loans as a percentage of assets for this group of banks was 70.68% at Dec. 31, 2018, compared with 64.4% at banks with more than $50 billion of assets, according to Capital Performance Group, which compiles the ranking for American Banker. (Click on the "view table" button at the end of this article to see the full ranking or on the links below to see the rankings for past years.)

See previous annual rankings for regional banks:

Even if interest rates stay put or decline, regional banks will be under pressure to raise deposit prices to remain competitive, said Kevin Halsey, a senior consultant at CPG. Online-only banks that are paying market-leading rates are a big part of the competition.

Deposit costs are already on the rise for regionals, as their median cost of funds at Dec. 31 was 0.73%, a 23-basis-point increase from a year earlier.

To make up for some of the margin compression, regionals will need to accelerate fee income, Halsey said. Total noninterest income for the group slowed from a 26.9% growth rate in 2017 to 3.6% last year.

The problem is regionals tend to lack the side businesses — capital markets and asset management for institutional investors, for example — that the big banks possess to offset downturns in loan demand.

"They need to boost revenue streams that aren't dependent on interest rates," Halsey said. "But that's a significant challenge as well."

The following chart provides a detailed overview of the performance of banks with assets of $10 billion to $50 billion; they are ranked by three-year returns on average equity.

Click on "view table" below to see the latest ranking.

View Table
Printer Friendly Version
Pressure's on regionals to boost fee income
Rank Institution/Ticker Location Total Assets ($000) 3-Year Avg. ROAE (%) ROAE (%) ROAA (%) Efficiency Ratio FTE (%) Net Interest Margin FTE (%) Net Income ($000) Asset Growth YOY (%) Net Income Growth YOY (%) Core Deposit Growth (%)
1 Bank of Hawaii Corporation (BOH) Honolulu, HI 17,143,974 16.23 17.63 1.29 55.94 3.05 219,602 0.32 18.91 0.35
2 Western Alliance Bancorp. (WAL) Phoenix, AZ 23,109,486 16.13 18.07 2.05 43.03 4.68 435,788 13.68 33.89 12.97
3 FirstBank Holding Company Lakewood, CO 18,578,162 15.14 17.16 1.5 53.39 3.64 271,116 5.73 27.55 6.11
4 East West Bancorp (EWBC) Pasadena, CA 41,042,356 14.6 17.04 1.83 45.25 3.78 703,701 10.56 39.17 -1.15
5 Commerce Bancshares (CBSH) Kansas City, MO 25,463,842 13.01 15.81 1.78 55.27 3.53 438,214 2.54 36.98 0.05
6 Midland Financial* Oklahoma City, OK 17,253,182 12.8 13.31 1.42 59.95 3.68 275,442 16.97 34.93 11.15
7 Bank OZK (OZK) Little Rock, AR 22,388,030 12.7 11.58 1.9 35.58 4.59 417,081 5.23 -1.15 -2.71
8 Pinnacle Bancorp* Omaha, NE 10,970,611 12.6 15.44 1.62 56.76 3.73 171,786 5.54 1.17 4.22
9 Bremer Financial Corporation St. Paul, MN 12,192,038 11.89 13.11 1.21 62.98 3.43 145,924 1.65 17.66 2.16
10 Home BancShares (HOMB) Conway, AR 15,302,438 11.83 13.17 2.06 37.64 4.42 300,403 5.9 122.38 1.84
11 Cullen/Frost Bankers (CFR) San Antonio, TX 32,292,966 11.76 13.85 1.47 55.34 3.64 454,918 1.72 24.93 0.84
12 FCB Financial Holdings Weston, FL 12,525,806 11.61 12.7 1.42 39.36 3.22 168,138 17.31 34.3 1.69
13 Signature Bank (SBNY) New York, NY 47,364,816 11.29 12.17 1.12 36.7 2.93 505,342 9.85 30.51 7.92
14 Glacier Bancorp (GBCI) Kalispell, MT 12,115,484 11.05 12.56 1.59 53.53 4.21 181,878 24.82 56.28 27.06
15 Cathay General Bancorp (CATY) Los Angeles, CA 16,784,737 10.72 13.18 1.7 43.69 3.79 271,885 7.32 54.44 -4.35
16 Synovus Financial (SNV) Columbus, GA 32,669,192 10.65 14.29 1.35 55.6 3.82 428,476 4.64 55.54 0.41
17 Ameris Bancorp (ABCB) Moultrie, GA 11,443,515 10.52 10.27 1.24 54.1 3.92 121,027 45.66 64.56 29.94
18 First Financial Bancorp. (FFBC) Cincinnati, OH 13,986,660 10.37 9.85 1.37 51.26 4.1 172,595 57.21 78.32 42.84
19 CVB Financial Corp. (CVBF) Ontario, CA 11,529,153 10.36 11 1.6 40.56 4.02 152,003 39.4 45.58 34.64
20 Webster Financial Corporation (WBS) Waterbury, CT 27,610,315 10.35 12.95 1.33 57.82 3.61 360,418 4.24 41.1 0.74
21 Texas Capital Bancshares (TCBI) Dallas, TX 28,257,767 10.35 12.72 1.19 52.64 3.75 300,824 12.69 52.65 -0.01
22 Heartland Financial USA (HTLF) Dubuque, IA 11,408,006 10.03 9.93 1.09 64.55 4.3 116,998 16.28 55.43 17.23
23 First Citizens BancShares (FCNA.A) Raleigh, NC 35,408,629 9.77 11.7 1.15 66.02 3.69 400,313 2.55 23.65 3.9
24 First Interstate BancSystem (FIBK) Billings, MT 13,300,200 9.66 10.5 1.27 58.87 3.88 160,200 8.9 50.39 6.53
25 Community Bank System (CBU) De Witt, NY 10,607,295 9.66 10.2 1.58 57.25 3.73 168,641 -1.29 11.89 -1.14
26 UMB Financial Corporation (UMBF) Kansas City, MO 23,351,119 9.6 8.91 0.93 69.02 3.21 195,513 7.26 -20.88 8.31
27 BOK Financial Corporation (BOKF) Tulsa, OK 38,020,504 9.55 11.94 1.28 60.99 3.19 446,424 17.81 32.99 15.96
28 Flagstar Bancorp (FBC) Troy, MI 18,531,000 9.55 12.57 1.04 73.93 3.08 187,000 9.57 196.83 31.82
29 International Bancshares Corp. (IBOC) Laredo, TX 11,871,952 9.42 11.63 1.81 50.5 3.98 218,735 -2.57 38.76 3.62
30 Wintrust Financial Corporation (WTFC) Rosemont, IL 31,244,849 9.42 11.07 1.18 61.04 3.61 343,166 11.92 33.17 10.58
31 Washington Federal (WAFD) Seattle, WA 16,188,126 9.34 10.26 1.3 49.37 3.25 205,122 3.88 11.51 4.21
32 BancorpSouth Bank (BXS) Tupelo, MS 18,001,540 9.13 10.6 1.28 65.76 3.72 221,317 17.67 44.62 17.51
33 United Community Banks (UCBI) Blairsville, GA 12,573,192 9.09 12.04 1.35 55.02 3.91 166,111 5.52 144.93 3.15
34 First Hawaiian (FHB) Honolulu, HI 20,695,678 8.99 10.76 1.31 46.6 3.16 264,394 0.71 43.94 4.44
35 First Horizon National Corp. (FHN) Memphis, TN 40,832,258 8.96 12.05 1.38 63.56 3.45 556,507 -1.43 214.45 4.69
36 MB Financial (MBFI)** Chicago, IL 20,207,026 8.76 7.23 1.07 63.29 3.81 213,915 0.6 -29.64 -1.43
37 Central Bancompany (CBCY.B) Jefferson City, MO 13,194,170 8.75 9.58 1.39 57.86 3.42 177,576 2.47 29.59 2.88
38 Cadence Bancorporation (CADE) Houston, TX 12,730,285 8.75 12.07 1.45 48.58 3.61 166,261 16.27 62.44 15.2
39 Hope Bancorp (HOPE) Los Angeles, CA 15,305,952 8.57 9.92 1.29 49.68 3.53 189,589 7.74 35.96 -4.62
40 Great Western Bancorp (GWB) Sioux Falls, SD 12,573,641 8.55 9.68 1.46 47.09 3.87 174,473 6.5 27.25 4.21
41 Simmons First National Corp. (SFNC) Pine Bluff, AR 16,543,337 8.47 10 1.37 53.06 3.97 215,713 9.88 132.1 3.71
42 Arvest Bank Group Bentonville, AR 18,576,135 8.43 9.59 1.02 73.77 3.77 184,945 10.65 37.1 8.08
43 PacWest Bancorp (PACW) Beverly Hills, CA 25,731,354 8.41 9.68 1.91 42.01 5.05 465,339 2.95 30.05 0.36
44 TowneBank (TOWN) Portsmouth, VA 11,163,030 8.41 9.47 1.3 61.91 3.61 137,774 30.99 48.48 28.6
45 Pinnacle Financial Partners (PNFP) Nashville, TN 25,031,044 8.37 9.37 1.53 46.18 3.6 359,440 12.72 106.6 10.51
46 Columbia Banking System (COLB) Tacoma, WA 13,095,145 8.35 8.78 1.36 55.37 4.33 172,882 2.97 53.23 0.02
47 Hancock Whitney Corporation (HWC) Gulfport, MS 28,235,907 8.26 11.04 1.17 56.77 3.38 323,770 3.29 50.15 -0.75
48 Fulton Financial Corporation (FULT) Lancaster, PA 20,682,152 8.25 9.24 1.03 65.39 3.4 208,393 3.22 21.33 3.28
49 CenterState Bank Corporation (CSFL) Winter Haven, FL 12,337,588 8.06 9.41 1.43 50.46 4.39 156,435 73.18 180.37 61.92
50 Pacific Premier Bancorp (PPBI) Irvine CA 11,487,387 7.92 7.71 1.26 51.66 4.44 123,340 43.15 105.22 44.82
51 Renasant Corporation (RNST) Tupelo, MS 12,934,878 7.82 8.64 1.32 58.87 4.16 146,920 31.59 59.37 27.01
52 Trustmark Corporation (TRMK) Jackson, MS 13,286,460 7.78 9.43 1.11 66.15 3.54 149,584 -3.71 41.61 7.45
53 Prosperity Bancshares (PB) Houston, TX 22,693,402 7.7 8.15 1.42 42.65 3.18 321,812 0.47 18.24 -2.85
54 Chemical Financial Corp. (CHFC) Detroit, MI 21,498,341 7.68 10.36 1.41 51.42 3.53 284,020 11.5 89.95 10.5
55 Associated Banc-Corp (ASB) Green Bay, WI 33,647,859 7.63 9.03 1.01 62.16 2.97 333,562 10.38 45.49 8.05
56 Union Bankshares Corp. (UBSH)*** Richmond, VA 13,765,599 7.57 7.85 1.11 54.57 3.74 146,248 47.78 100.55 39.34
57 Stifel Financial Corp. (SF) St. Louis, MO 24,519,598 7.57 13.06 1.73 80.84 2.56 393,968 14.66 115.43 5.14
58 WesBanco (WSBC) Wheeling, WV 12,458,632 7.54 8.68 1.26 52.99 3.52 143,112 26.92 51.47 27.87
59 Sterling Bancorp (STL) Montebello, NY 31,383,307 7.36 10.3 1.45 38.69 3.56 447,254 3.37 380.76 3.23
60 South State Corporation (SSB) Columbia, SC 14,676,328 7.35 7.63 1.23 56.57 4.09 178,871 1.45 104.3 0.79
61 Valley National Bancorp (VLY) Wayne, NJ 31,863,088 7.31 7.91 0.86 58.8 3.11 261,428 32.75 61.47 19.16
62 Hilltop Holdings (HTH) Dallas, TX 13,683,572 7.25 6.51 0.93 86.56 3.56 125,727 2.38 -5.57 10.02
63 Apple Financial Holdings New York, NY 14,307,254 7.24 8.77 0.75 58.46 2.56 100,900 11.7 33.78 -1.79
64 Banner Corporation (BANR) Walla Walla, WA 11,871,317 7.14 10.45 1.29 63.46 4.43 136,515 21.59 124.62 13.03
65 Old National Bancorp (ONB) Evansville, IN 19,728,435 7.08 8.42 1.07 61.54 3.54 190,830 12.62 99.35 12.26
66 First Midwest Bancorp (FMBI) Chicago, IL 15,505,649 7.02 8.21 1.07 56.75 3.9 157,870 10.15 60.46 1.45
67 Eastern Bank Corporation Boston, MA 11,381,576 6.9 9.02 1.1 68.36 3.87 122,727 4.67 41.56 5.75
68 IBERIABANK Corporation (IBKC) Lafayette, LA 30,833,015 6.89 9.54 1.25 54.95 3.75 370,249 10.5 159.98 5.47
69 United Bankshares (UBSI) Charleston, WV 19,250,498 6.86 7.84 1.36 49.44 3.57 256,342 1 70.24 4.07
70 Umpqua Holdings Corporation (UMPQ) Portland, OR 26,939,781 6.68 7.9 1.21 58.16 4.04 316,263 4.9 30.52 -1.31
71 F.N.B. Corporation (FNB) Pittsburgh, PA 33,101,840 6.68 8.3 1.16 54.91 3.38 372,858 5.36 87.17 2.29
72 People's United Financial (PBCT) Bridgeport, CT 47,877,300 6.52 7.75 1.04 58.55 3.12 468,100 7.7 38.82 5.97
73 First BanCorp. (FBP) San Juan, PR 12,243,561 6.52 10.64 1.65 53.7 4.74 201,608 -0.14 201.11 10.99
74 BCI Financial Group Miami, FL 14,332,955 6.04 6.64 0.76 58.28 3.06 95,663 40.84 98.36 47.84
75 Berkshire Hills Bancorp (BHLB) Boston, MA 12,212,231 5.91 6.84 0.9 59.02 3.43 105,765 5.54 91.44 -2.81
76 Popular (BPOP) Hato Rey, PR 47,604,577 5.83 11.36 1.33 56.92 4.34 618,158 7.51 474.06 14.76
77 Investors Bancorp (ISBC) Short Hills, NJ 26,229,008 5.54 6.57 0.8 55.89 2.73 202,576 4.38 59.83 -6.17
78 Third Federal Savings and Loan Assoc. Cleveland, OH 14,238,626 4.91 4.73 0.51 64.16 2.04 71,004 2.53 -2.7 -8.04
79 Utrecht-America Holdings New York, NY 24,093,694 -0.36 6.37 0.72 64.9 2.76 173,207 0.15 NM -4.88
  Median for all institutions   17,253,182 8.55 10.2 1.29 55.94 3.64 205,122 7.32 47.03 4.44
  Median for the top 10   17,915,672 12.91 15.63 1.7 54.33 3.71 287,923 5.64 30.72 2
  Average for all institutions   20,722,980 8.97 10.53 1.3 55.95 3.65 257,088 11.99 68.89 9.35
  Average for the top 10   20,344,412 13.69 15.23 1.67 50.58 3.85 337,906 6.81 33.15 3.5


Notes: Ranking is of top consolidated bank holding companies, banks, and thrifts with total assets of between $10 billion and $50 billion as of 12/31/18 and is based on three-year average ROAE from 2016 to 2018. Additional data is for the 12 months ended 12/31/18; year-over-year changes compare 2018 to 2017. Financials are from SEC filings. If unavailable, regulatory financials were used. Excludes industrial banks, nondepository trusts, foreign-owned banks, and bankers' banks, as well as institutions with credit cards to total loans of more than 25%, loans to total assets of less than 20%, or loans to total deposits of less than 20% at 12/31/18. Excludes institutions with a leverage ratio of less than 5%, Tier 1 risk-based capital ratio of less than 6%, or total risk-based capital ratio of less than 10% during any quarter in the ranking period. Excludes institutions that received a tax benefit of greater than 10% of net income or that did not report data for any year in the ranking period. Also excludes institutions that have fewer than five depository branches and are owned by a company not primarily focused on commercial or retail banking. Ties broken using the 2018 ROAE and subsequently the 2017 ROAE.

* Denotes an institution that operated as a subchapter S corporation for at least one quarter between 2016 and 2018. Its profitability ratios were calculated from regulatory financials and adjusted using an assumed tax rate.

** Sold to Fifth Third Bancorp on March 22, 2019.

*** The former Union Bankshares changed its name and ticker symbol on May 20.

Source:

Capital Performance Group
analysis of data provided by S&P Global Market Intelligence.