Behind the numbers: 5 takeaways from NCUA's Q3 data

The National Credit Union Administration last week released its Quarterly Credit Union Data Summary for the third quarter of 2019. The report included details on growth trends at federally insured CUs nationwide, including consolidation, lending, delinquencies, return on average assets and more. Read on for highlights from the report.

CU Journal's coverage from Q1 and Q2 can are also available.

Number of CUs Q3 2019 - CUJ 120619.jpeg

Institutions and members

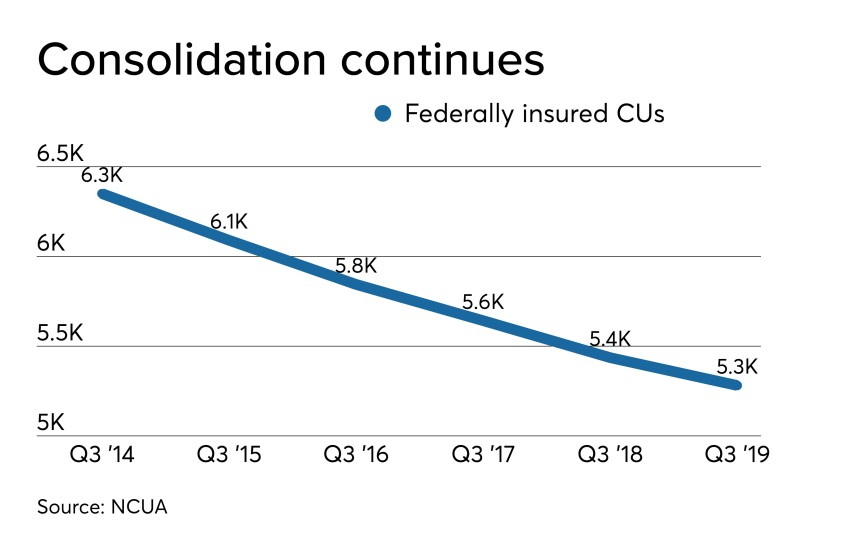
While credit union mergers have slowed somewhat this year, the number of institutions operating continues to decline, hitting 5,281 at the end of the third quarter, 155 fewer credit unions than one year prior. The number of low income-designated credit unions continues to rise, however, hitting 2,615, a 2% increase from the same time last year.

While many states have updated their state credit union statutes in recent years to help state-chartered institutions better compete, federally chartered CUs continue to dominate the industry, making up more than 60% of all active institutions. NCUA reports 3,321 FCUs in business at the end of Q3 compared to 1,960 federally insured state-chartered shops.

Regardless of charter type, membership at federally insured credit unions was up by 4.1 million members year-over-year, for a total of 119.6 million members nationwide.
Q3 loan growth - CUJ 120619.jpeg

Loans and delinquencies

The industry continues to see strong lending, with total loans up $61 billion (5.9%) year-over-year to a total of $1.1 trillion. The average credit union loan balance during Q3 stood at $15,530, a 1.7% increase ($262) from the previous year.

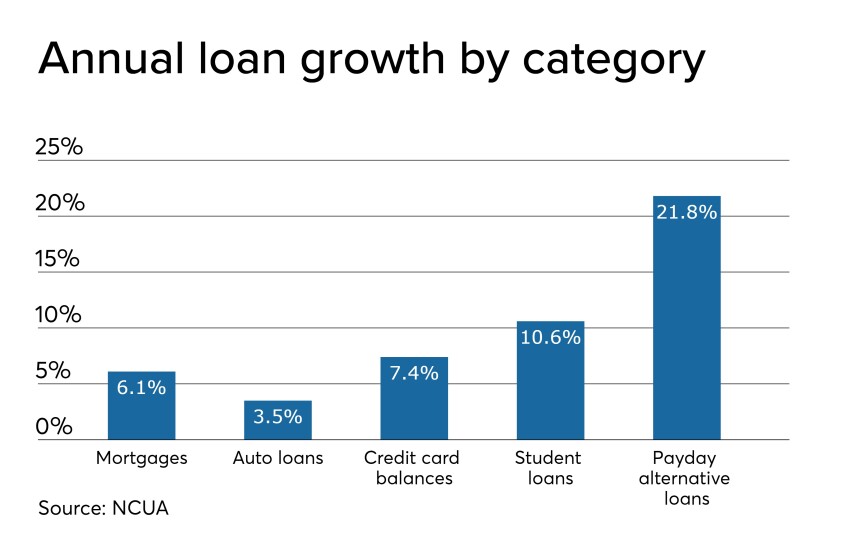
Loan balances rose in every category during the third quarter, some with double-digit increases. Most significantly, commercial loans were up 13.2% ($9.1 billion) to a total of $78 billion. Private student lending at credit unions saw a 10.6% increase to reach $5.5. billion, while credit card balances were up 7.4% to top $63.8 billion.

More traditional credit union lending products also fared well, though not as strongly. Auto lending was up $12.6 billion (3.5%) in Q3 to reach $374.2 billion. Broken down by category, used car loans were up 4.4% to $226.9 billion while new auto loans saw a 2.1% increase to reach $147.3 billion. Mortgage lending rose 6.1% to hit $466.8 billion.

Delinquency rates held steady during the third quarter at 67 basis points, unchanged from one year prior. The net charge-off ratio for federally insured CUs was down two basis points year-over-year to 55 BPs.
Q3 interest and expense - CUJ 120619.jpeg

Income and expenses

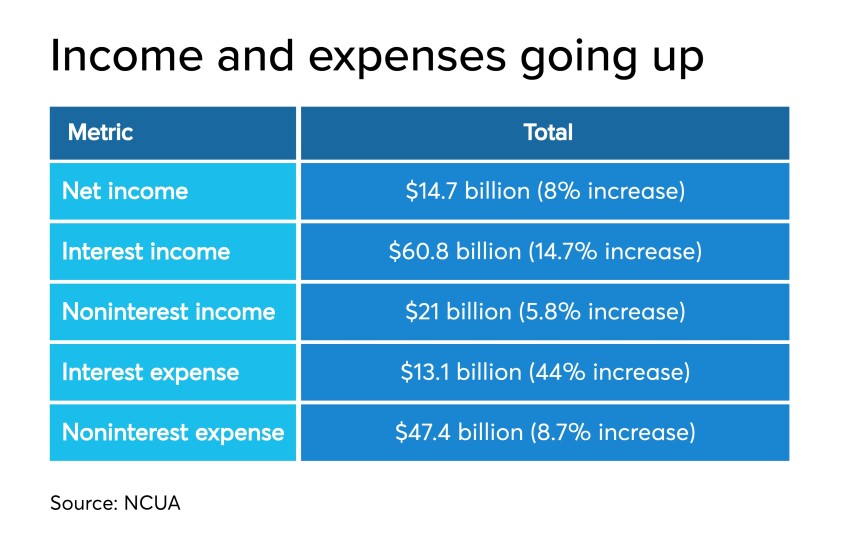
Net income continues to rise across the industry, with credit unions earning 8% more in the third quarter of 2019 than one year prior, for total net income of $14.7 billion.

Reflecting ongoing strong lending trends, interest income was up 14.7% ($7.8 billion) to hit $60.8 billion, while non-interest income saw a 5.8% lift to $21 billion.

Expenses were also up, however, with interest expense totaling $13.1 billion, a $4 billion (44%) increase from one year prior. Noninterest expenses were also up, reaching $47.7 billion, an 8.7% ($3.8 billion) increase from the end of Q3 2018. NCUA credited rising labor costs (up 9.2% from one year before) as contributing to more than half of the increase in noninterest expense.

Aggregate net interest margin grew by 8.6% ($3.8 billion) during the 12 months ending Sept. 30 for a total of $47.7 billion, while industry-wide provisions for loan and lease losses inched up 40 basis points to $6.4 billion.
Q3 ROA - CUJ 120619 (1).jpeg

Assets and deposits on the rise

Assets at federally insured credit unions continue to rise, up $98 billion (6.8%) annually to reach $1.54 trillion as of Sept. 30, 2019. The industry’s net worth also continues to improve, up by 8.5% ($13.7 billion) to $175.2 billion at the close of Q3. The CU system’s aggregate net worth ratio, which measures net worth as a percentage of assets, rose by 11.21% on the year to reach 11.39% at the end of September.

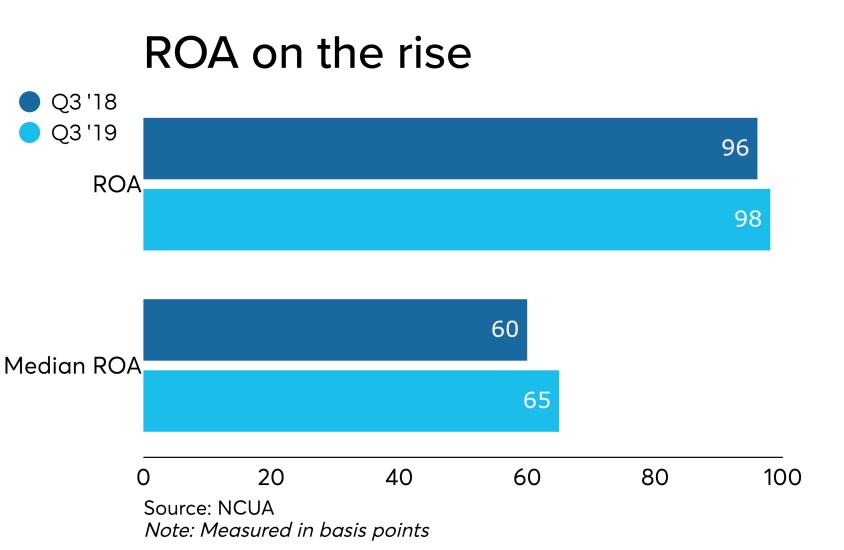
Return on average assets was up slightly year-over-year, a two-point increase to hit 98 basis points at the close of Q3. Median ROA across all federally insured credit unions was up five points from the third quarter of 2018 to hit 65 BPs.

Shares and deposits at credit unions grew by 6.9% ($83.7 billion) to top $1.29 trillion during Q3, though regular shares dropped 40 basis points to $443.1 billion. Other deposits rose, however, for a total increase of 10.2% ($60.2 billion), totaling $648.9 billion. Share certificate accounts, in particular, saw a dramatic increase, rising 22.3% or $50.5 billion.

As reported, credit unions have spent much of 2019 in a battle for deposits, with individual institutions unveiling their own strategies to boost funding and NCUA making moves to allow for easier access to nonmember deposits.

More coverage on these issues can be found here.
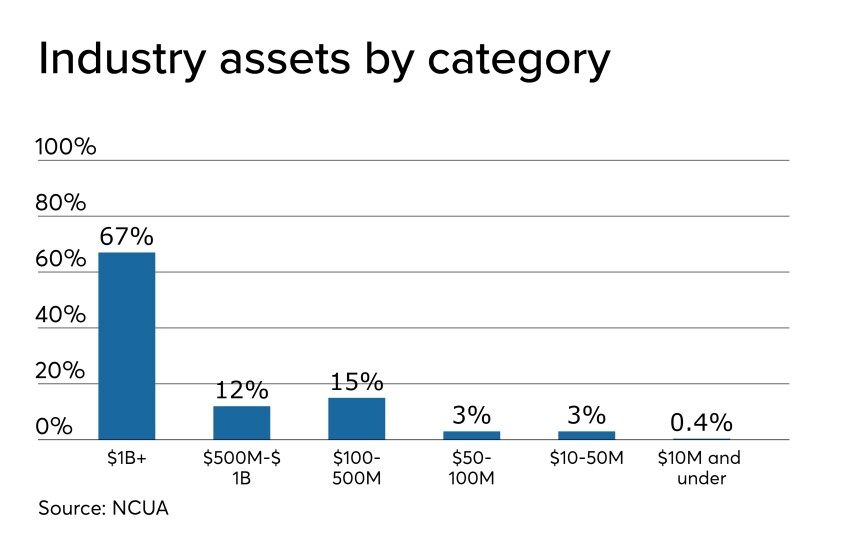
CU assets by category - CUJ 120619.jpeg

"Great Divide" widens

The gap between large and small credit unions – and those who are growing versus those who aren’t – continues to widen. NCUA reports that an additional 16 credit unions joined the $1 billion-asset and above club in the 12 months ending Sept. 30. Those 319 institutions hold $1 trillion in assets, 67% of the industry’s total. CUs in this asset category saw loan growth of 8.8% during the past year and membership rise 7.9%. Net worth for these CUs was up 12%.

At the opposite end of the spectrum, CUs under $10 million in assets saw their ranks decline by 95 to a total of 1,352 operating institutions. While they account for 25% of the total number of credit unions nationwide, this asset class holds just 0.4% of the industry’s assets ($5.6 billion). Making matters worse, credit unions in this category saw declines in several categories, including loans (a 4.7% drop), membership (down 8.7%) and net worth (a 4.5% decline).

Mid-size credit unions, with assets from $100 million to $500 million, make up a similar portion of the industry (19.5% of all CUs). The number of credit unions in this category was down by 19 compared to one year prior, though 15 new credit unions joined the $500 million to $1 billion-asset category. CUs in the $100-500 million asset class, representing 15% of total industry assets ($225.1 billion) saw declines in membership (5.4%), net worth (0.3%) and lending (3.3%).
MORE FROM AMERICAN BANKER