Measuring the pandemic's impact: 5 takeaways from NCUA's Q2 data

New data from the National Credit Union Administration offers a clearer picture of how the industry has been impacted by the coronavirus pandemic.

The agency's Quarterly Credit Union Data Summary for the second quarter, released last week, offers wider insights into how credit unions have performed since the COVID-19 outbreak overtook the nation. Because this report came out at the start of the final month of the third quarter, the data largely confirms what many in the industry already knew: lending is down, deposits and loss reserves are up, and margins are being squeezed in a way they haven't been since the Great Recession.

CUJ 090420 - NCUA Q2 OVERALL (2).jpeg

But this data is notable because it provides a fuller picture of the toll the pandemic and economic downturn have taken on credit unions of all sizes, but particularly at the lower end of the asset spectrum. Because the outbreak began in mid-March, much of the industry's first-quarter results were shielded by two relatively normal months. The second-quarter data covers a period when much of the country was in lockdown, many nonessential businesses were shuttered and consumer spending had dropped substantially.

Read on for highlights from the report. A look at first-quarter data can be found here.
CUJ 090420 - MEMBERSHIP.jpeg

Membership slows as consolidation continues

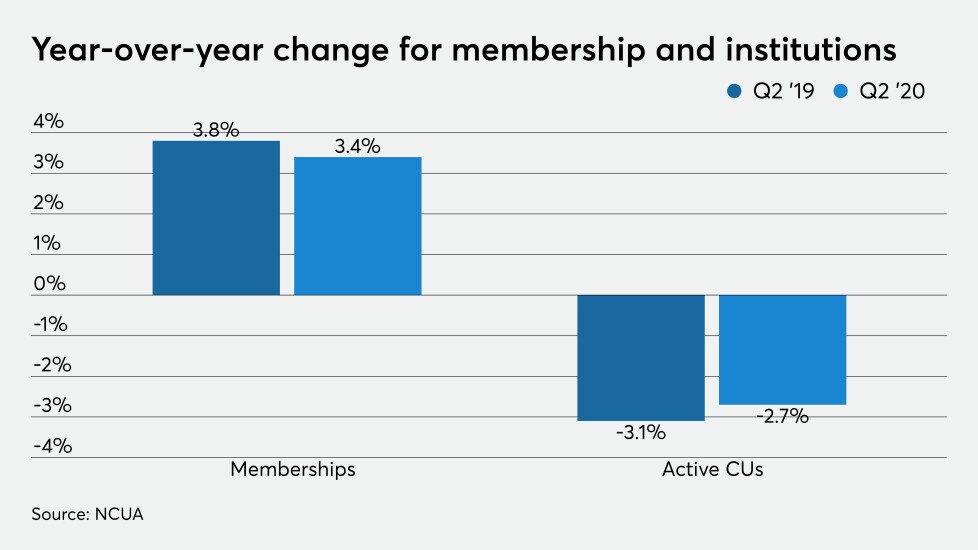
Credit unions added 4 million members to reach a total of 122.3 million in the second quarter, an increase of about 3.4%, slightly slower than the 3.8% pace of growth seen one year prior.

The number of active credit unions continued to decline in the second quarter, dropping 2.7% to hit 5,164 institutions. While social-distancing guidelines have forced many credit unions to delay merger votes, NCUA’s pace for approving mergers did not dramatically change in the first half of 2020, despite the pandemic.

The number of active federal charters still greatly exceeds state charters, by a margin of 3,232 to 1,932, respectively. Federal charters have declined by about 3% in the last year while state charters have dropped by 2%. Analysis this summer showed state-chartered credit unions are growing their memberships faster than their counterparts with federal charters.

The number of credit unions with a low-income designation rose by just over 1% to 2,652, a gain of 34 institutions.
CUJ 090420 - Q2 LOANS.jpeg

Mixed bag for lending

Total lending increased by $70 billion (6.6%) to $1.1 trillion. While that’s a slightly faster pace than the 6.4% growth seen at the end of June 2019, the industry’s total outstanding loan balance is largely unchanged from a year ago.

Mortgages, far and away the biggest loan category for gains, saw a $42.8 billion (9.4%) year-over-year increase to total $499.6 billion at the end of the second quarter. Mortgages rose by 6% in the year ending June 30, 2019, and many analysts have said much of the recent growth in this sector can be attributed to consumers moving to take advantage of historically low rates. With many other loan categories slowing down, some have suggested mortgages account for well over 90% of all credit union loan growth so far this year.

Auto lending saw only modest gains in the year ending June 30, rising just 1.1% to a total of $374.5 billion. New auto loans were up 3.9% while used car loans rose by 3.3%. Overall the auto market for credit unions grew by 5.2% in the 12 months ending June 30, 2019.

Private student loans at credit unions were up by $400 million (7.5%) to $5.7 billion, a stark drop from the 14.6% growth rate seen a year earlier. With the pandemic leading many students to rethink college, there are concerns that broader changes in higher education could trickle down to credit unions, leading to further reductions in growth for this sector.

Driven in part by loans made through the Paycheck Protection Program, commercial lending at credit unions was up 17.4% ($13.1 billion) to hit $88.6 billion. Commercial loan growth at the end of the second quarter last year stood at 11.6%.

Lastly, after a year in which credit card balances rose 7.7%, the 12-month period ending June 30 saw a 2.4% decline ($1.5 billion) to $60.9 billion.

Federally insured credit unions reported a delinquency rate of 58 basis points, a five-point decline from one year earlier. The net charge-off ratio was also slightly improved, standing at 53 basis points, down from 56 basis points a year ago.
CUJ 090420 - Q2 ASSETS.jpeg

Assets up, ROA down

Total assets at federally insured credit unions rose 15.1% ($229 billion) in the year ending June 30, to reach $1.75 trillion. Asset growth in the preceding 12-mont period was 6.3%.

Return on average assets was down more than 40%, dropping from to 57 basis points, compared with 97 basis points at the close of the second quarter last year. Median ROA also declined, dropping 38% to hit 39 basis points, a 24 basis-point decline.

The industry’s net worth ratio also declined, falling to 10.46% from 11.27% the year before. The loan-to-share ratio was down as well, falling 7 percentage points to 76.3%.

Deposit growth rose substantially, up 15.8% ($188 billion) from one year prior for a total of $1.3 trillion. Deposit growth at the close of the second quarter last year was 5.5%.
CUJ 090420 - Q2 NET INCOME.jpeg

Rough road for income and expenses

Net income fell substantially in the second quarter, dropping 34.6% ($5 billion) from one year prior. NCUA said the decline was due in part to increased provisions for loan and lease losses and credit loss expenses.

The CU system saw a 51.5% increase ($3.3 billion) in its provision for loan and loss leases or credit loss expenses, hitting $9.7 billion. That figure was on the decline just a year ago, falling 4.8% at the end of the second quarter of 2019.

Interest income was up just 1.5% ($900 million) to hit $60.9 billion, while noninterest income grew 5.2% to reach $21.6 billion. Interest income a year ago was up by more than 15%.

The industry’s net interest margin was also lower, standing at 2.88% of average assets, or $47.8 billion. At the end of June 2019, that figure was 3.18% or $47.3 billion. Aggregate net interest margin grew by 1.1%.

Credit unions’ net worth ratio has fallen as well, dropping to 10.46% compared with 11.27% at the end of the first half of 2019.

After a 46.1% year-over-year lift in interest expense at the close of June 2019, interest expense at the end of the second quarter this year was up by just 3% from one year earlier, totaling $13.1 billion.

Noninterest expenses rose $3.3 billion (7%). NCUA said increasing labor costs – which rose 8.7% ($2.1 billion) accounted for almost two-thirds of the increase in noninterest expenses at federally insured credit unions.
CUJ 090420 - Q2 GROWTH.jpeg

Large credit unions shielded from some of the damage

The pandemic has impacted credit unions of all sizes, but institutions below $1 billion in assets have seen a disproportionate share of the damage.

In every asset class under $1 billion, membership, loan balances and net worth decreased in the year ending June 30, according to NCUA’s data. Those are consistent with long-running trends for many institutions on the lower end of the asset spectrum, but these latest results are notable for the uniformity of losses across multiple asset groups. In the year ending June 30, 2019, for example, credit unions in some of categories experienced declines in membership but gains in lending. Not so for the second quarter of 2020.

Large credit unions – which account for just 7% of total institutions but 70% of industry assets – saw sizable gains across a variety of metrics. Net worth and loans at CUs of $1 billion or more were up by 12% while membership rose 10.2%.

Forty new institutions also joined the $1 billion-asset club in the year ending June 30, an increase of 12.6%.

Larger credit unions may have been protected from some of the problems their smaller counterparts experienced because of greater likelihood to offer mobile banking services, including loan originations, along with a more diversified field of membership, which kept those institutions better protected if certain segments of their member base lost work due to shutdowns.
MORE FROM AMERICAN BANKER